





In this article, we will explore what the Stochastic Oscillator is, how it works, and how it can be combined with MACD Confirmation System in the Technical Convergence method.
Concept of the Stochastic Oscillator
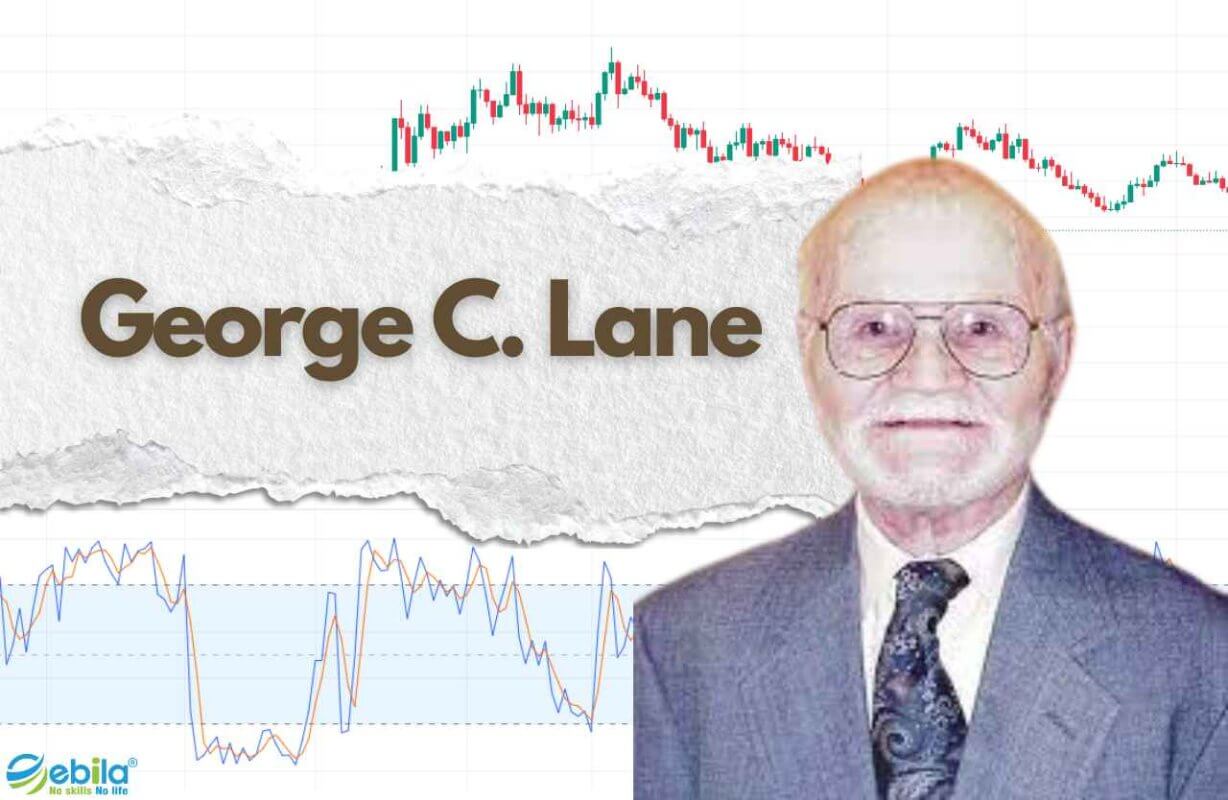
The Stochastic Oscillator, often referred to as Stochastic or STO, is a popular technical indicator in technical analysis. It was developed by George C. Lane in the 1950s.
The Stochastic indicator reflects the momentum of prices, providing a basis for investors to find trend reversal points.
Stochastic is a common indicator in technical analysis that compares the closing price to a price range within a specific time frame, thereby showing price momentum.
This indicator consists of two components: the %K line and the %D line. %K is the main and fast line, while %D is a 3-period moving average of %K used to smooth the %K line.
1. %K (Fast Stochastic):
This is the primary and fast indicator of the Stochastic Oscillator. It calculates the difference between the current closing price and the lowest price within a specific time period and then divides it by the difference between the highest and lowest prices during that time.
2. %D (Slow Stochastic):
%D is a smoothed moving average of %K. It helps smooth the %K line to create a faster-moving curve. %D is often displayed on the chart and is used to understand buying and selling signals.
Difference Between Stochastic Oscillator and Other Indicators
An important point to remember is that the Stochastic Oscillator differs from other indicators like Bollinger Bands or MACD (Moving Average Convergence Divergence).
While the MACD confirmation system forecasts long-term market trends, the Stochastic confirmation system predicts short-term market trends.
The Stochastic Oscillator is typically used to identify market reversal points or assess overbought or oversold conditions of an asset.
Technical Convergence with Stochastic Oscillator

Stoch Convergence
The Stochastic Oscillator is a tool that helps investors identify short-term trends in the financial market. In the technical convergence of Stochastic, there are three main lines: the red line (short-term), the blue-violet line (medium-term), and the yellow line (long-term).
If the indicator shows all three lines converging and crossing over the overbought zone (80), it indicates that the market is overbought. This signals that the upward trend may be weakening and likely to reverse. Here, we can consider SELL.
On the other hand, if the indicator shows all three lines converging and crossing over the oversold zone (20), it indicates that the market is oversold. It also suggests that prices may have bottomed out and are preparing for a new uptrend. Here, we can consider BUY.
Convergence between Stoch and Other Tools
Using a single tool to confirm the financial market is risky. Convergence in the confirmation system is also the same. In Stochastic, there is already a convergence of overbought and oversold signals, but that alone is not enough to make investment decisions.
It should be combined with the MACD system , Bollinger Bands, and other more specialized systems. To understand how to create convergence in the confirmation system, click here.
Risk Management
Risk management is an important aspect of financial trading. The Stochastic Oscillator can help you identify potential points to set stop-loss and take-profit levels.
This helps protect your investment capital from unnecessary losses and optimizes risk management.
Conclusion
The Stochastic Oscillator confirmation system is truly an excellent tool in technical analysis. It not only enhances the accuracy of analysis but also becomes a reliable tool for investors.
With the Stochastic Oscillator, you not only see buy or sell signals but also understand how the market trend is moving.
Remember, every tool has its limitations, but when you use the Stochastic Oscillator in combination with technical convergence knowledge and your trading skills, that’s when you’ll come close to grasping the market.
You might enjoy:


