




The Fibonacci Sequence
Elliott did not discover the Fibonacci relationship in wave himself, but it gained attention in Elliott’s work thanks to Charles Collins.
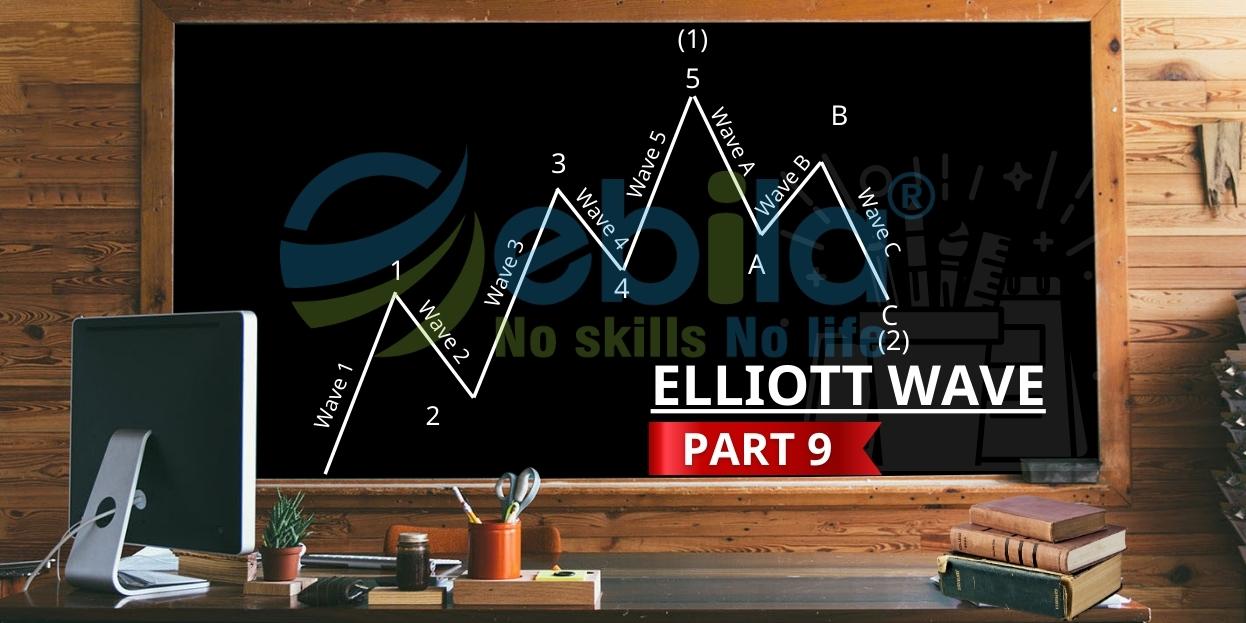
The wave calculations of both impulse and corrective wave patterns (5 + 3 = 8) follow the Fibonacci sequence, and dividing wave patterns into corresponding sub-waves also generates the Fibonacci sequence.
Analyzing the Fibonacci relationships between price swings is highly important for several reasons.
Firstly, it helps maintain wave analysis integrity. The application of Fibonacci ratios to wave calculations enhances the accuracy of those calculations, as it creates a connection between related waves in one way or another. Furthermore, it assists in predicting achievable targets once correct wave calculations are identified, or various scenarios are distinguished.
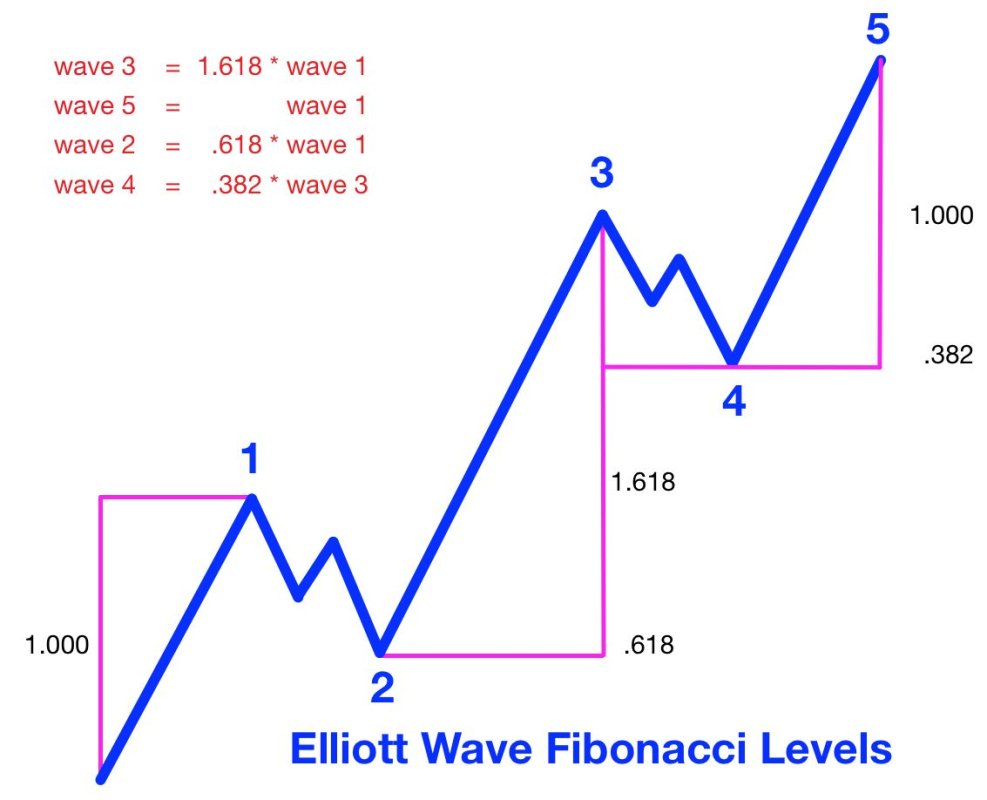
Waves are often related to each other through ratios such as 2.618, 1.618, 1, 0.618, 0.382, and 0.236. This aids in estimating price targets for expanding waves.
Wave 1
This initial wave often originates from the speculative market downtrend (recession), making wave 1 rarely identifiable right from the start. During this phase, fundamental information is still negative. The market direction before wave 1 occurs primarily remains in a recessionary state. Trading volume might slightly increase in the direction of price rise. However, the price increase is insignificant. Therefore, many technical analysts fail to recognize the presence of wave 1.
Typically, traders do not engage in trading during wave 1; instead, they wait for wave 1 to complete formation before calculating the amplitudes of the subsequent waves.
Wave 2
Wave 2 typically retraces at least 38.2%, but mainly 61.8% or more of wave 1. It often retraces to the territory of wave 4 (within the smaller-degree wave) of wave 1 and frequently ventures into the area of wave 2 (within the smaller-degree wave) of wave 1. A retracement beyond 78.6% can be quite dubious even though it hasn’t violated any rules. The reason wave 2 exhibits a substantial retracement ratio is that most investors believe the long-term downtrend will persist and view wave 1 as a mere corrective upward move within the trend. This behavior aligns with the characteristics of a bearish selling wave.

Wave 3
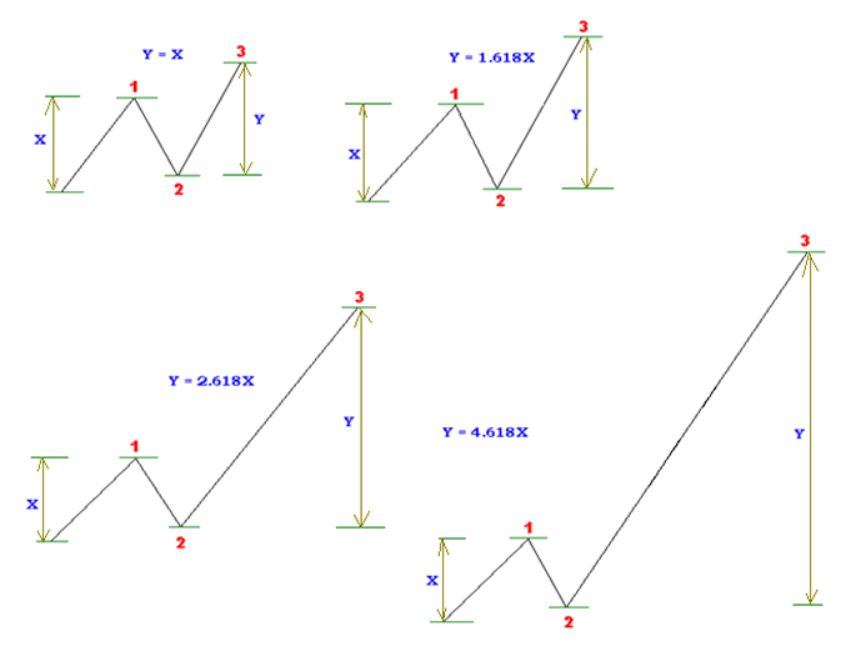
Wave 3 is typically at least equal to wave 1 in length, except for the cases of Leading Diagonal (LD) and Ending Diagonal (ED) patterns (in these two cases, wave 3 is shorter than wave 1). If wave 3 is an extended wave and is the longest among waves 1, 3, and 5, it tends to be around 161.8%, or even 261.8% or 461.8% of the length of wave 1. To identify wave 3, pay attention to its slope, as wave 3 usually has a steeper and more vertical slope than wave 1. Additionally, observe technical indicators in the wave 3 region, where trading volume tends to be higher, and momentum is stronger.
WAVE 4
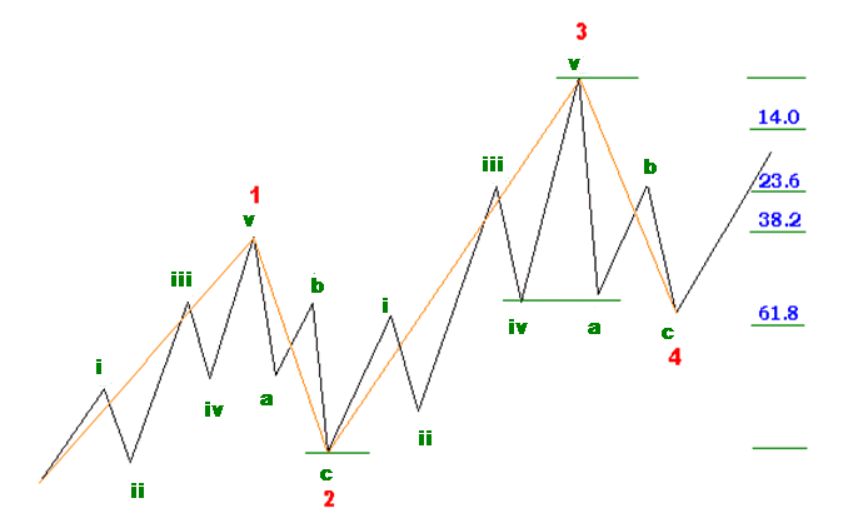
Wave 4 usually retraces approximately 38.2%, 50%, or 61.8% of wave 3’s length if wave 3 is not an extended wave. In the case of an extended wave 3, wave 4 often retraces only about 23.6% or 38.2% of wave 3’s length. In very strong markets, wave 4 might only retrace around 14% of wave 3.
Wave 4 tends to retrace into the price territory of wave 4 within the lower-degree wave of wave 3.
Wave 5
Wave 5 is usually equal in length to wave 1 or extends a distance of 61.8% of the length of wave 1.
It can also be equal to 38.2% or 61.8% of the combined length of wave 1 and wave 3 (measured from the bottom of wave 1 to the top of wave 3).
If wave 5 is an extended wave, it will be around 161.8% of the length of wave 3 or 161.8% of the combined length of wave 1 and wave 3.
Note: If wave 5 is not an extended wave, there will be divergence between the high/low of wave 3 and wave 5. If wave 5 is an extended wave, it’s difficult to observe divergence.
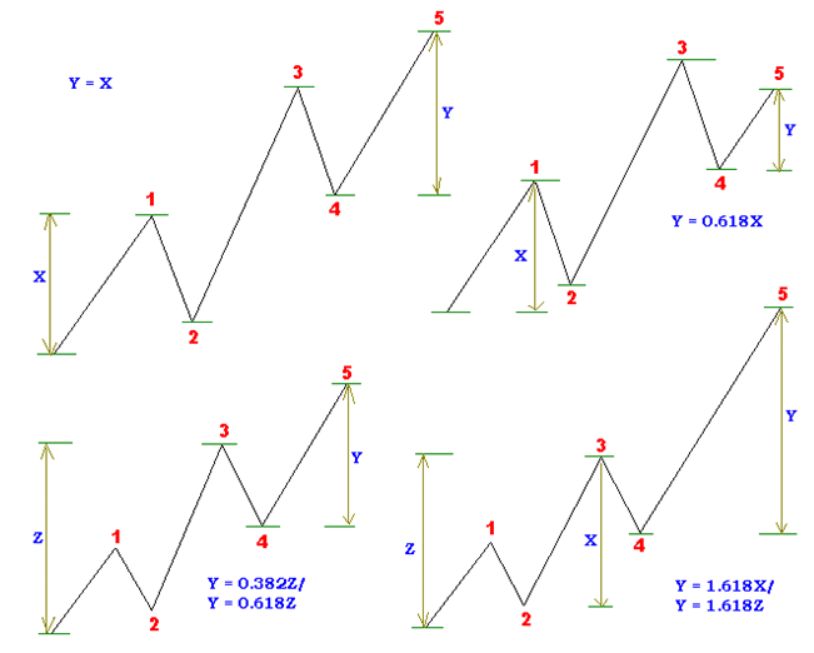
Target of expanding wave
In a 5-wave impulse sequence (1-2-3-4-5), it’s expected that one of the three waves, 1, 3, or 5, will be extended. If wave 3 is extended, waves 1 and 5 will tend to be equal in terms of price oscillation length or equal in terms of the duration of price oscillation.
In the forex market, for example, an extended wave 3 usually accounts for 60% of the movement, an extended wave 5 for 35%, and an extended wave 1 for only 5% of the total movement within the sequence.
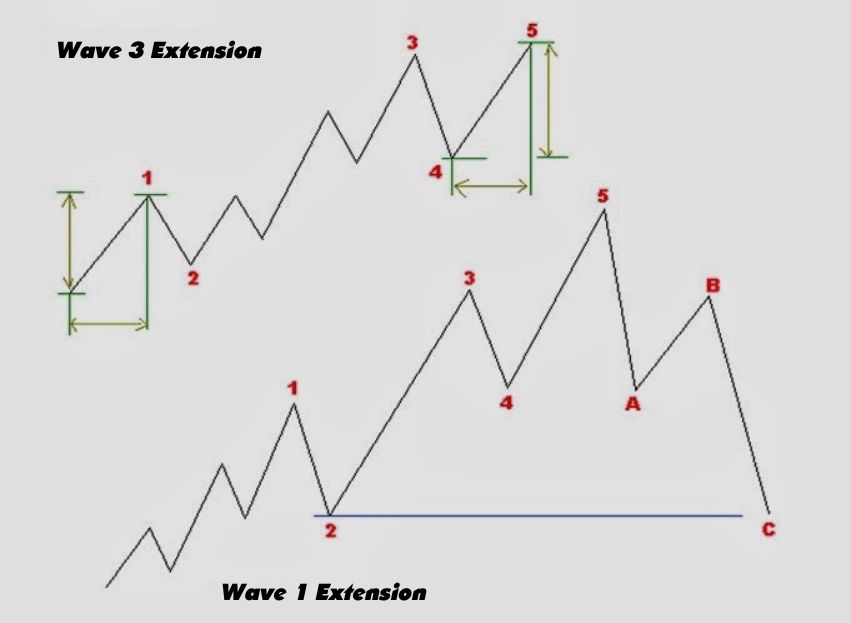
When an extended wave within a 5-wave sequence is wave 1, the subsequent corrective process will typically retrace back to the region of wave 2 instead of the usual retracement to wave 4. This is especially accurate when wave 5 is shorter than wave 3.
Corrective wave
Correction processes tend to bring prices back to the region of wave 4 at the smaller-degree wave level. They often surpass this region and enter the area of wave 2 at an even smaller-degree wave level. If the correction develops in a Flat (FL) pattern or Contracting Triangle (CT) pattern, it usually stays within the range of 38.2% to 50.0%, and this holds true even when the correction is wave 2.
A retracement level of less than 38.2% of the preceding price movement indicates underlying strength in the main trend. The 50.0% retracement level is common within a 5-wave sequence, but it’s not as frequent as the 61.8% retracement level. However, the 50.0% retracement level is quite prevalent in increasing corrective waves in speculative markets, for example, in wave B within a Zigzag (ZZ) pattern.
Wave A
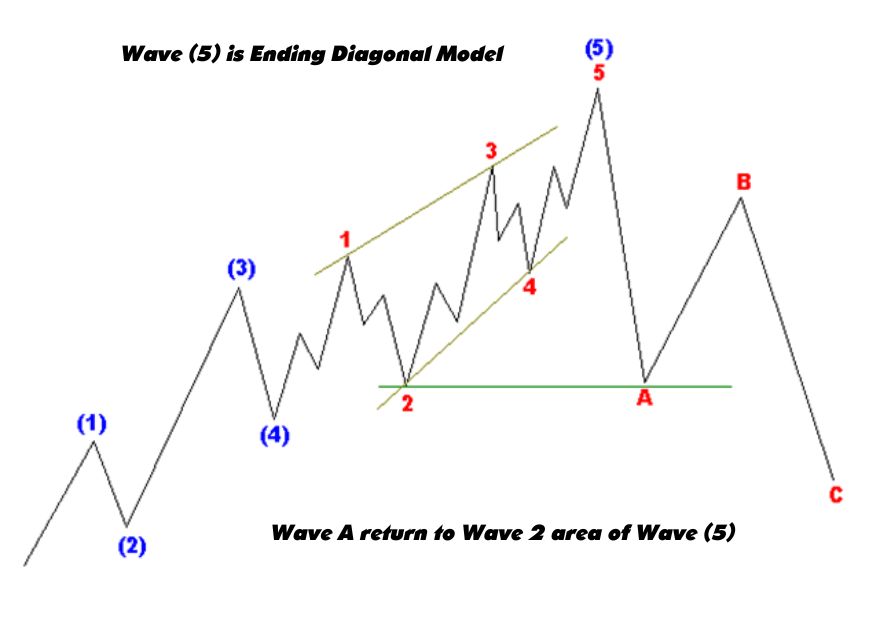
After an Ending Diagonal (ED) pattern in wave (5), wave A retraces back to wave 2 of that Ending Diagonal (ED) pattern.
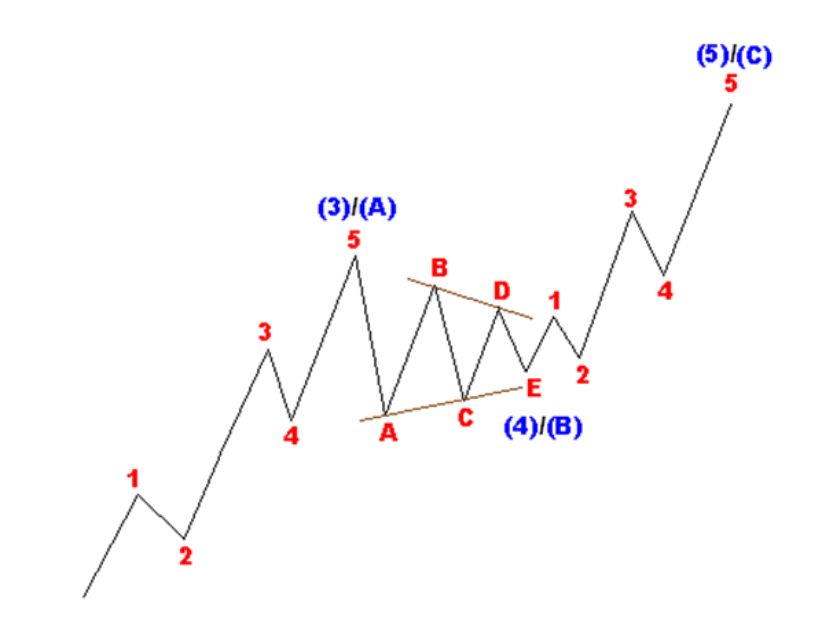
When wave A is part of a Contracting Triangle (CT) pattern, wave (B) or wave (4), it typically retraces around 38.2% of the entire preceding five waves and enters the price territory of wave 4 within those five waves.
Wave B
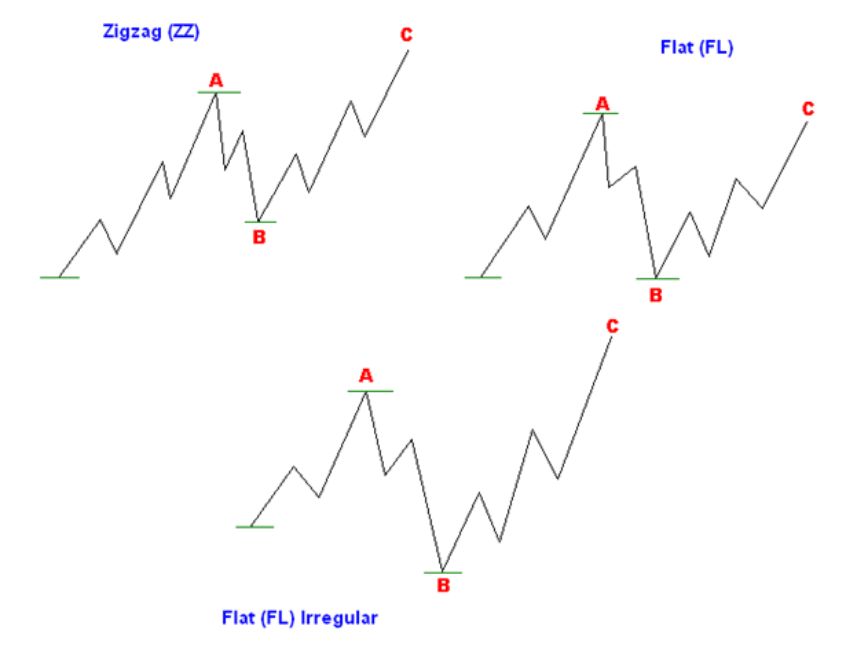
In a Zigzag (ZZ) pattern, wave B typically retraces around 38.2% or 61.8% of wave A.
In a Flat (FL) pattern, wave B approximately equals wave A. In an Irregular Flat (FL) pattern, wave B often extends by a distance of around 123.6% to 127% of wave A.
Wave C
Wave C has a minimum length of 61.8% of wave A. It can be shorter in cases of Zigzag (ZZ) Running or Flat (FL) Running patterns, where wave C is very short and cannot exceed the endpoint of wave A.
In general, wave C is equal to wave A in length or extends by a distance of around 161.8% of wave A. Wave C often reaches the 161.8% length of wave A in an Irregular Flat (FL) pattern.
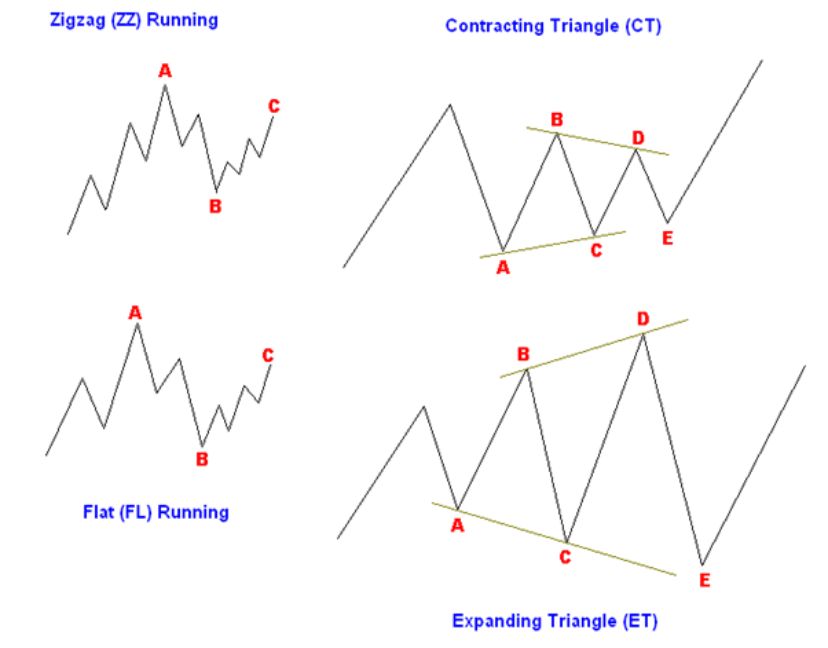
In a Contracting Triangle (CT) pattern, wave C often equals 61.8% of wave A.
In an Expanding Triangle (ET) pattern, wave C typically equals 161.8% of wave A.
Wave D
In a Contracting Triangle (CT) pattern, wave D often equals 61.8% of wave B.
In an Expanding Triangle (ET) pattern, wave C typically equals 161.8% of wave B.
Wave E
In a Contracting Triangle (CT) pattern, wave E often equals 61.8% of wave C.
In an Expanding Triangle (ET) pattern, wave E typically equals 161.8% of wave C.
Wave X
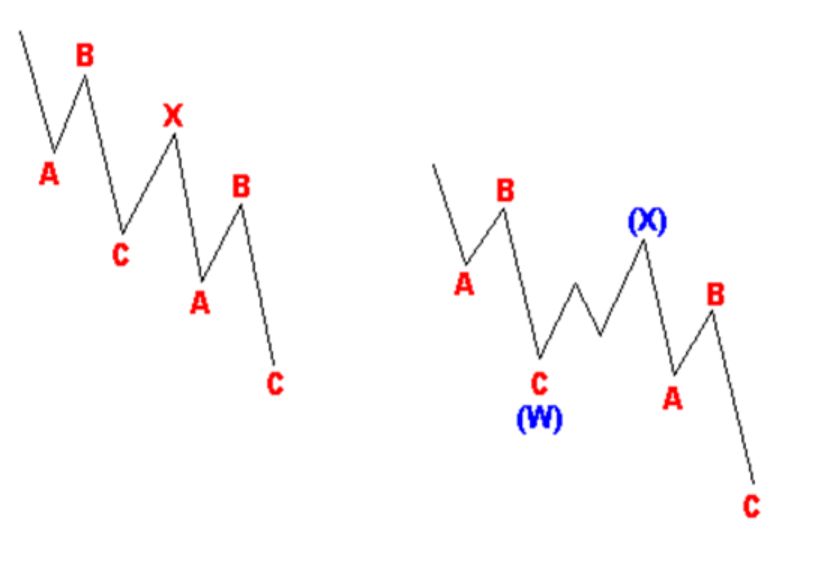
Wave X retraces a minimum of 38.2% of the preceding A-B-C correction; a retracement of 61.8% is also common for wave X.
And thus, we have obtained the fundamental concepts of wave patterns and the price-related relationships between waves. Actually, these are ancient knowledge and have been around since the early days of the market. In order to update practical knowledge and make it relevant to the current market, I am delighted to share with you about 2 Million - Dollar - Patterns in the Financial Market.

So, now is your task! Practice on real charts everyday and gain experiences for yourself! GOOD LUCK!


 follow the Fibonacci sequence)