





1. How The Theory of Elliott Wave was born?
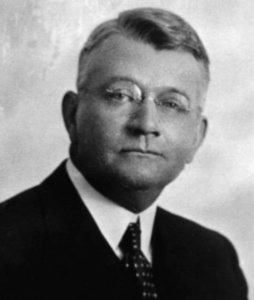
The Elliott Wave Theory, named after Ralph Nelson Elliott (July 28, 1871 – January 15, 1948), is a concept rooted in the world of finance. Elliott was a professional accountant and an American author with a keen interest in market behavior.
Through the meticulous analysis of historical stock market data spanning numerous years, Elliott made a remarkable observation. He realized that financial markets do not operate in random chaos. Instead, they move within a specific order, characterized by repetitive cycles. These cycles reflect the actions and emotions of individuals influenced by external factors and crowd psychology.
As time went on, the Elliott Wave Theory extended beyond its application solely within the realm of stock market analysis. It found relevance across various financial markets, including the dynamic realm of Forex trading. This theory’s principles, shaped by human psychology and market dynamics, hold true and applicable in a wide array of financial environments.
| Elliott explained that the oscillations of crowd psychology, whether upwards or downwards, consistently reveal recurring patterns across different segments. Recognizing this phenomenon, Elliott then coined the term ‘wave’ to describe these segmented patterns. By doing so, he uncovered the essence of market action segmentation. This discovery allowed Elliott to conduct a deeper analysis of markets, identifying distinct features within these wave patterns. Consequently, he was able to make more insightful predictions about the market, based on the wave patterns he identified. This breakthrough provided him with a comprehensive framework to comprehend market behavior in a more nuanced manner. |
One of the most evident arenas to observe this phenomenon is in financial markets, where investor psychology is recorded in the form of price fluctuations.
Elliott distinguished 11 patterns of price fluctuations, often referred to as wave patterns. He named, defined, and illustrated these patterns. He elucidated their formation and their larger versions.
The Elliott Wave Theory is a collection of price patterns and an explanation of possible positions within the broader developmental process of the market. Markets tend to follow periods of development, alternating between phases of growth and decline, constructing segments through similar patterns of increasing size.
In 1938, Elliott first published his theory on market patterns in a book titled The Wave Principle.
In 1939, he summarized the wave theory through a series of articles published in the Financial World magazine.
Finally, in 1946, Elliott comprehensively expounded the wave theory in his ultimate magnum opus, Nature’s Laws: The Secret of the Universe.
2. Structure of Elliott Wave Model
The Elliott Wave Theory reveals that in a basic wave pattern, there are 5 motive waves (impulse waves) numbered 1-2-3-4-5, and 3 corrective waves numbered A-B-C.
Among the 5 motive waves, waves 1, 3, and 5 are called motive waves, while waves 2 and 4 are corrective waves. Within each of these waves, there are smaller waves that also follow the rules of the Elliott Wave Theory. A complete motive wave has 89 sub-waves, and a complete corrective wave has 55 sub-waves.
In essence, the pattern of 8 complete waves forms the typical Elliott Wave structure. This pattern can follow an ascending direction in a bull market or a descending direction in a bear market.
If the main trend is upward, we will see 5 upward-running waves followed by 3 downward-running waves. If the main trend is downward, we will observe 5 downward-running waves followed by 3 upward-running waves that correct the main trend.
Ralph Nelson Elliott asserted that he researched and developed the wave theory before he became aware of Fibonacci, yet the astonishing coincidences of numbers emerged: 5 motive waves, 3 corrective waves, 89 motive waves, 55 corrective waves, as well as the price ratios of the waves constantly hovering around the Fibonacci ratios of 0.618, 1.618, 0.328.
Hence, there’s an alternative theory suggesting that Ralph Nelson Elliott incorporated Fibonacci numbers into his theory.
3. Three Principles in Elliott Wave
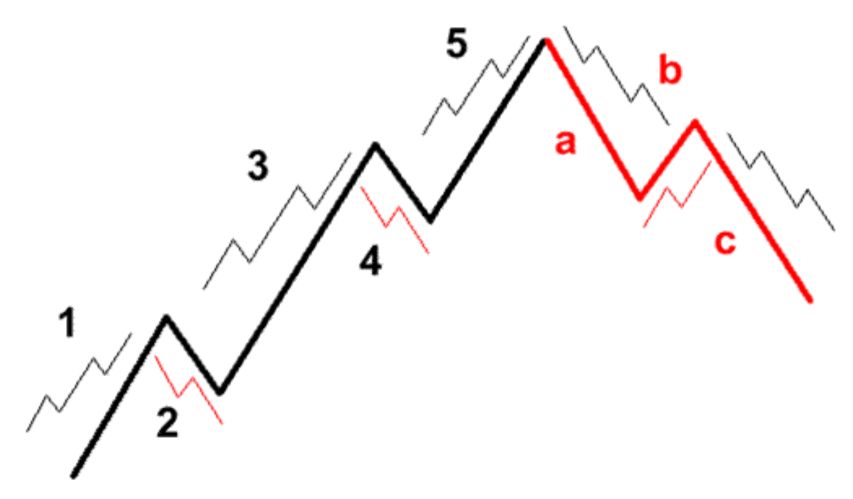
A valid Elliott Wave pattern must adhere to the following three rules:
- Wave 2 must not retrace beyond the starting point of Wave 1.
- Wave 3 should not be the shortest among the motive waves 1-3-5.
- In an impulsive wave, Wave 4 must not overlap the price territory of Wave 1.
4. Wave in Elliott Wave
The Elliott structures described also conform to the conventional definition of a fractal, as similar patterns self-replicate at all levels of a trend.
“We can understand a fractal as the geometry of infinite detail, where when we zoom in on any part, a new pattern emerges resembling the original whole. For instance, observe a broccoli head; each smaller branch, when magnified, appears as a new broccoli head.”
Practitioners of the Elliott Wave theory suggest that, similar to natural fractals which tend to expand and develop intricacies over time, this pattern reflects the collective human psychology evolving within natural patterns. Through buying and selling decisions reflected in market prices: “It’s as though we are mathematically programmed in some way. Seashells, galaxies, snowflakes, or humans: we all seem to be bound by the same order.”
The patterns discovered by Elliott are constructed using the same methodology. For instance, an impulsive wave pattern, which typically follows the main trend, consistently presents itself with 5 waves within its structure. On a smaller scale, each of these motive waves within the impulsive wave pattern contains 5 smaller waves. In this smaller wave pattern, the same repeating wave structure occurs. This is the phenomenon of waves within waves, commonly known as fractals.
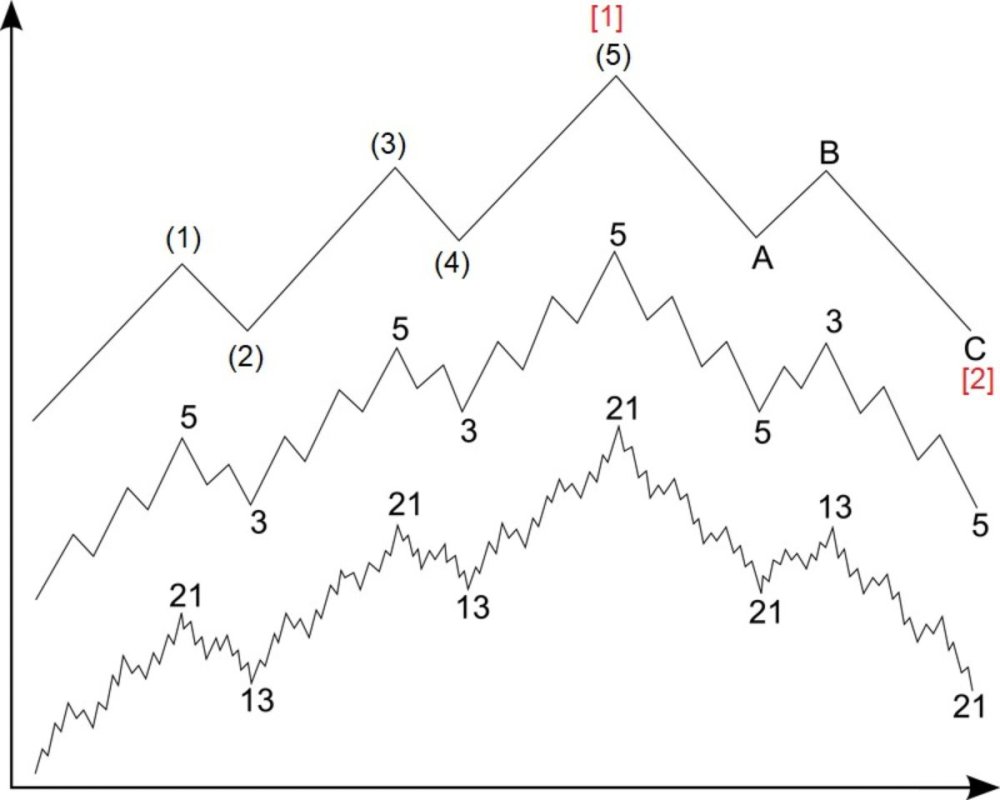
The first link in the chain is the impulse wave pattern ending at the peak of Wave 1. This pattern indicates that price oscillations at a higher wave level are also ascending. It also signals the initiation of the corrective chain of 3 waves, which is Wave 2. Waves 3, 4, and 5 complete the larger motor impulse wave as Wave 1.
The motive wave structure of Wave 1 demonstrates that price oscillations at a higher wave level are ascending. The subsequent corrective process in Wave 2 is followed by Waves 3, 4, and 5, completing the motive wave chain of a higher wave level, which is Wave 1.
Once again, the corrective process through 3 waves at the same wave level occurs as Wave 2. This sequence continues to develop, culminating in the completion of the entire process.
5. Wave Levels in Elliott Wave
Each degree of a pattern within a financial market has a distinct designation. Numerals from 1 to 5 or Roman numerals (I to V) are used to signify each wave within a sequence, indicating the function and level of movement. Alphabet letters (A – B – C, W – X – Y – Z) denote corrective waves (typically observed in the highest level of three-wave structures or idealized wave degrees).
These degrees are relative; they are determined by form, not absolute scale or time. Waves of the same degree can vary greatly in scale and/or time.
The classification of a wave at a specific degree may vary, although practitioners generally agree on the standard degree sequence. There are 9 motive wave degrees, ranging from cycles spanning centuries (Grand super cycle) to cycles lasting only a few minutes (Subminuette).
- Grand Supercycle: The largest-degree wave, spanning many decades and sometimes even centuries.
- Supercycle: A higher-degree wave lasting from several years to a few decades.
- Cycle: A wave degree lasting from 1 to several years.
- Motive: A major trend wave degree lasting from several months to 2 years.
- Intermediate: A medium-term trend wave degree lasting from several weeks to several months.
- Minor: A minor trend wave degree lasting within a few weeks.
- Minute: A small trend wave degree lasting within a few days.
- Minuette: A very small trend wave degree lasting within a few hours.
- Subminutte: An extremely small trend wave degree lasting within a few minutes.
In actual trading, you don’t necessarily need to memorize the names of these wave degrees. It’s more important to have a solid grasp of the trading theories associated with Elliott Waves.
6. Name and Symbol of 11 Wave Models
- Impulse Pattern (abbreviated as IM)
- Leading Diagonal Triangle Pattern (abbreviated as LD)
- Ending Diagonal Triangle Pattern (abbreviated as ED)
- Zigzag Pattern (abbreviated as ZZ)
- Double Zigzag Pattern (abbreviated as DZ)
- Triple Zigzag Pattern (abbreviated as TZ)
- Flat Pattern (abbreviated as FL)
- Double Three Pattern (abbreviated as D3)
- Triple Three Pattern (abbreviated as T3)
- Contracting Triangle Pattern (abbreviated as CT)
- Extending Triangle Pattern (abbreviated as ET)
| You have already read about: Overall knowledge of the Elliott Wave model In the next article, I will share with you about: Market Psychology Following The Elliott Wave |


, is a concept rooted in the world of finance.)