




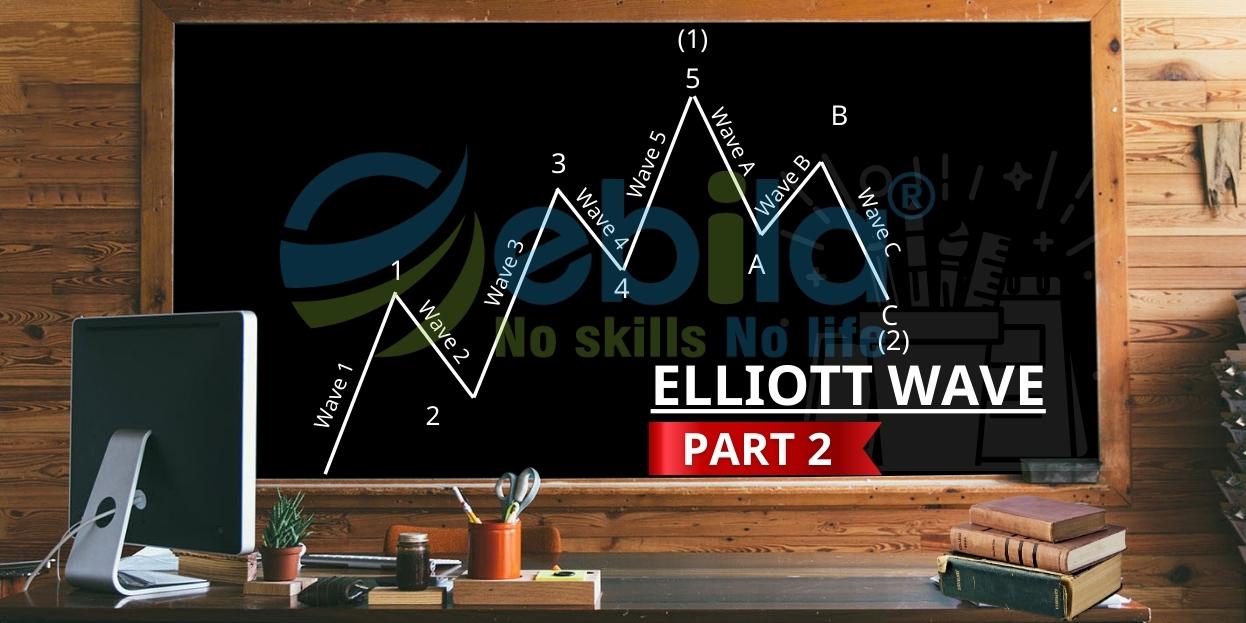
To understand totally the Elliott Wave theory, one needs to grasp the market psychology at each wave step, as price oscillations in a zigzag fashion reflect shifts in the optimistic or pessimistic sentiments of investors.
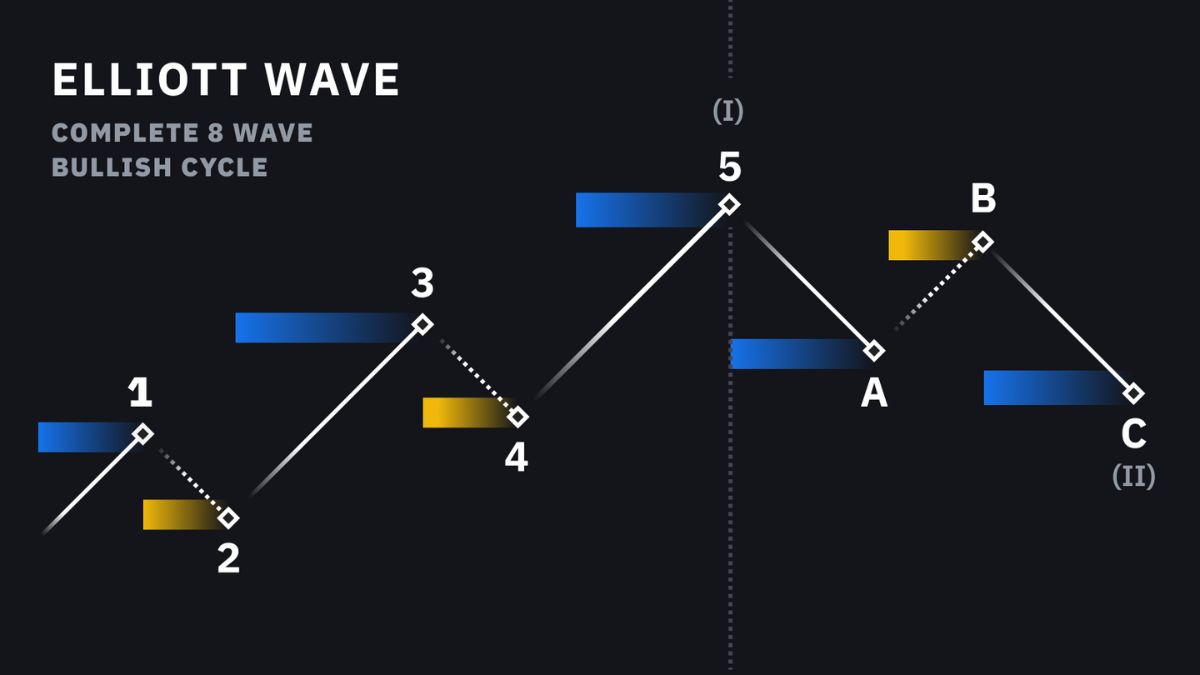
Below is an analysis of the psychological dynamics of the typical 8-wave pattern in a bull market. The analysis would be reversed in the case of a bear market.
Motive Wave 1 in Elliott Wave:
This initial wave originates from a bear market (recession), which is why it’s often not recognized right away. At this point, fundamental information remains mostly negative. The market trend prior to Wave 1 is still primarily one of decline. Trading volume might show a slight increase in the direction of rising prices, but the price increase itself is insignificant. As a result, many technical analysts might fail to notice the presence of Wave 1.
Motive Wave 2 in Elliott Wave:
motiveWave 2 is a correction of Wave 1, but the lowest point of Wave 2 never falls below the starting point of Wave 1. News for the market remains unimpressive. The market declines towards the end of Wave 2 to “test” the market’s lows. Those who adhere to the bear market trend still believe that the bear market trend is in control. Trading volume will be lower than that of Wave 1. Prices will undergo a corrective decrease and usually remain within the range of 0.382 to 0.618 of the highest point of Wave 1.
Motive Wave 3 in Elliott Wave:
This is typically the largest and strongest wave of the uptrend. At the beginning of Wave 3, the market still receives negative information, so many investors are not prepared to buy. As Wave 3 progresses, the market starts to receive positive fundamental information. Despite minor corrections within Wave 3, the prices of Wave 3 increase at a relatively rapid pace. The highest point of Wave 3 is usually higher than the highest point of Wave 1, often at a ratio of 1.618% or even 261.8%.
Motive Wave 4 in Elliott Wave:
This is truly a corrective wave. Prices tend to move downward and sometimes form an elongated saw-tooth pattern. Wave 4 typically corrects Wave 3 by a range of 0.382 to 0.618 of Wave 3’s length. The trading volume during Wave 4 is lower than that of Wave 3. This is the time to buy if investors recognize the potential continuation immediately after Wave 5. However, identifying the termination point of Wave 4 is one of the challenges for technical analysts adhering to the Elliott Wave theory.
Motive Wave 5 in Elliott Wave:
This is the final leg of the 5 motive waves. Positive information floods the market, and everyone believes that the market is in a bullish trend. The trading volume during Wave 5 is significant, although typically still smaller than Wave 3. Interestingly, many “non-professional” investors often buy near the end of Wave 5. Towards the end of Wave 5, the market swiftly changes direction. The highest point of Wave 5 usually surpasses the high of Wave 3 by a ratio of 161.8%.
Corrective Wave A in Elliott Wave:
This wave marks the beginning of the corrective wave A-B-C sequence. During the time of Wave A, fundamental information still remains optimistic. Despite the price decline, most investors continue to believe that the market is in a bullish trend. The trading volume tends to grow steadily along Wave A. Wave A usually retraces from 38.2% to 61.8% of Wave 5.
Corrective Wave B in Elliott Wave:
Prices increase again and reach a higher level compared to the end point of Wave A. Wave B is considered an extension of the bullish market sentiment. For those who follow classical technical analysis, the B point is often seen as the right shoulder of the Head and Shoulders chart pattern. The trading volume of Wave B is usually lower than that of Wave A. At this point, fundamental information does not offer new positive points, but it hasn’t completely turned negative either. Wave B typically retraces from 38.2% to 61.8% of Wave A.
Corrective Wave C in Elliott Wave:
Prices tend to decrease more rapidly than in previous waves. Trading volume increases. Almost all investors clearly perceive the dominance of the bearish market sentiment, especially in the slowest sub-wave of Wave C. Wave C is typically as large as Wave A or often extends 1.618 times or more compared to Wave A.
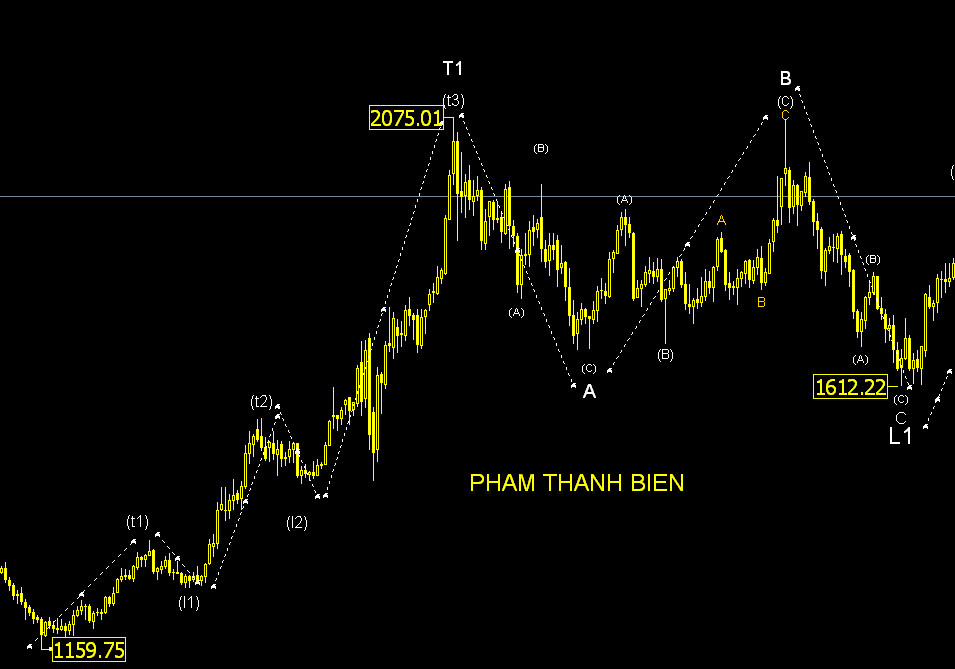
The model above is the overall knowledge. In order to have practical experience applying to the recent financial market, you should observe the below one.
| You have just read the article: Market Psychology Following Elliott Waves In the next article, I will share with you about: Impulse waves For reviewing the last part: Overall Knowledge of The Elliott Wave |


